[Author Note: This article is targeted toward channel partners, but is also applicable to anyone wishing to champion Nutanix / Dell XC hyperconvergence within their organizations.]
With 32 different manufacturers now offering hyperconverged infrastructure (HCI) solutions, customers are increasingly asking channel partners to help them choose between HCI vs. conventional 3-tier infrastructure (centralized storage + storage fabric + servers). Skillfully guiding customers through the financial modeling process can help them better evaluate the differences between the legacy and next-generation technologies.
Faster Horses
Henry Ford famously said that if he had asked his customers what they wanted, they would have told him, “faster horses.” As organizations increasingly virtualized their datacenters, they encountered problems such as manufacturer finger pointing when troubleshooting, and ordering and standing up the compute, storage and networking components in a reasonable time frame.

In response to these issues, every leading storage manufacturer came out with what they called a “converged infrastructure” solution including HP Matrix, Vblock, Flexpod, IBM PureFlex, Hitachi Unified Compute Platform, EMC VSPEX and so on. But these solutions lack any true innovation and, for that matter, any infrastructure convergence. They are simply faster horses.
I wrote an article a few months ago titled, The 10 ways Nutanix is Uberizing the datacenter. Suppose we were able to go back in time 30 years and approach a would-be taxi passenger standing in the rain fruitlessly trying to hail a cab.
We could tell her that in the future a company called Uber would use new technologies such as the Internet and smart phones and GPS to transform her transportation experience. Future rides would be simple, predictable and pleasant. Lacking the context to understand these new technologies would likely result in skepticism that Uber could do this.

Nutanix partners often encounter this same type of challenge with people in IT, Purchasing and Finance who are used to looking at the datacenter through a 3-tier lens. Their first impulse is naturally to evaluate hyperconverged solutions in the same manner that they have long used for analyzing their conventional infrastructure purchases.
But metrics such as cost per gigabyte and even acquisition cost are often irrelevant or misleading when evaluating hyperconvergence. A Total Cost of Ownership (TCO) or Return on Investment (ROI) analysis, depending upon the use case, provides a far better framework for evaluating a major technology decision.
Counter-intuitively, while a TCO or ROI analysis will inevitably show a lower cost for HCI than 3-tier, this is not its primary purpose. The objective of taking customers through the financial modeling process is to give them the context to understand the full implications of Nutanix technology. In this way, they can appreciate why Nutanix is not just a faster horse, but how it is going to transform their experience of managing IT.
Challenges of 3-Tier Infrastructure
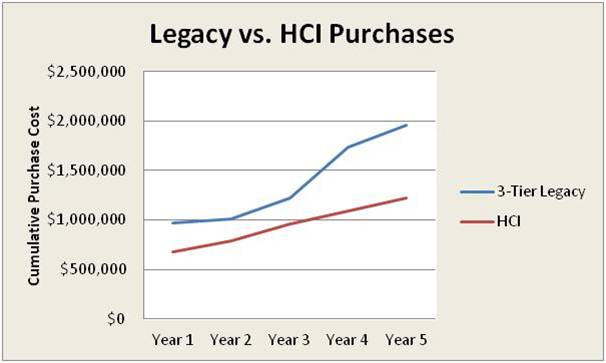
I recommend that you start the TCO/ROI analysis process by explaining the inherent financial penalties of 3-tier infrastructure. When customers, for example, purchase a SAN – they typically try to predict the workloads they will need 3 – 5 years down the road, and then purchase an array with enough headroom to expand storage capacity to hopefully meet those requirements.
If a SAN-purchaser guesses wrong and under-buys, the organization faces a massive forklift upgrade that’s very expensive, complex and time-consuming. Wikibon estimates that the cost just to migrate to a new array is 54% of the cost of a new array.
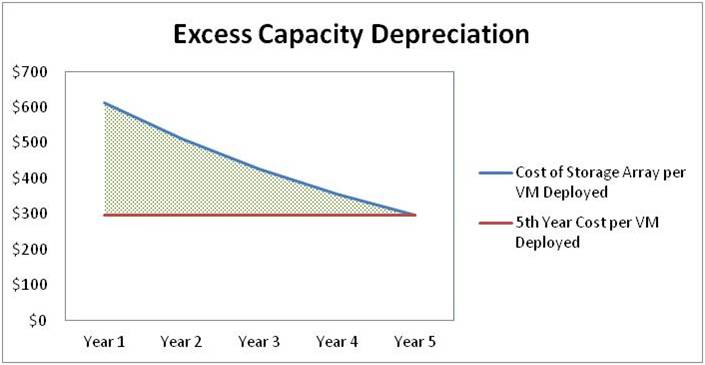
As a result, customers typically buy SANs with “room to grow”. But this extra capacity requires a large investment (the “I”) which then reduces the ROI. And as shown in Table 1, this excess capacity starts depreciating on the first day it is installed.
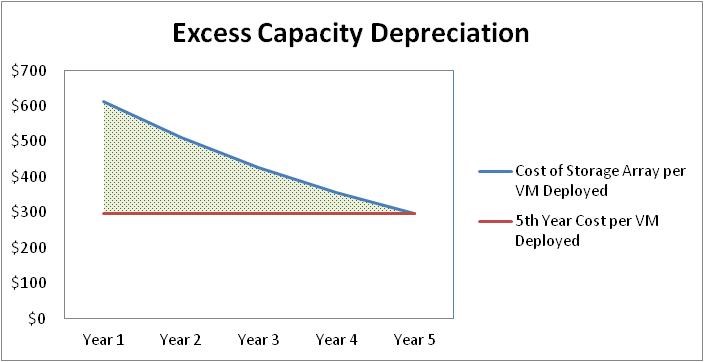
Table 1: Depreciation Expense from Purchasing Excess Capacity Up-Front
The excess capacity also requires more rack space, power and cooling even as it sits idle. And as the customer utilizes the capacity over the years, the technology becomes increasingly out of date when compared with the new equipment of the day. This equates to inferior performance, less capabilities and features, and more rack space, power and cooling expense than would be realized with newer technology.
Mnemonic: Don’t lose on price, a 5-year analysis is nice. Nutanix won’t always be less than a 3-tier up-front alternative. This is why it is important for the customer to evaluate alternatives over an extended period – typically five years.
The Advantages of Moore’s Law for HCI
HCI provides customers with the exact opposite experience of 3-tier. Unlike a SAN which requires a large up-front investment and then quickly becomes old technology, Nutanix lets customers start as small as three nodes, and then seamlessly scale out as needed – even one node at a time. This both enhances the ROI while completely eliminating the risk of over-buying.
Since Nutanix storage clusters are completely separate and removed from the virtualization clusters, they are not subject to the VMware size limitations. And scale is not limited to a single cluster; a customer can have several clusters, all managed with Prism Central. In this manner, Nutanix also eliminates the much more punishing risk of under-buying.
As customers expand their Nutanix environments by purchasing additional nodes, they bring the latest technology into their environment in terms of CPU, memory, disk and flash. This increases the workload density per node, resulting in a lower cost per workload.
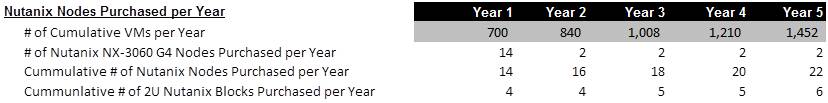
Table 2 below shows an example of a typical VDI customer migrating 5,000 PC users to VDI in conjunction with their 5-year refresh rate. Each year rather than getting new PCs, 1,000 users have their devices locked down or receive zero-clients and are migrated to virtual desktops.
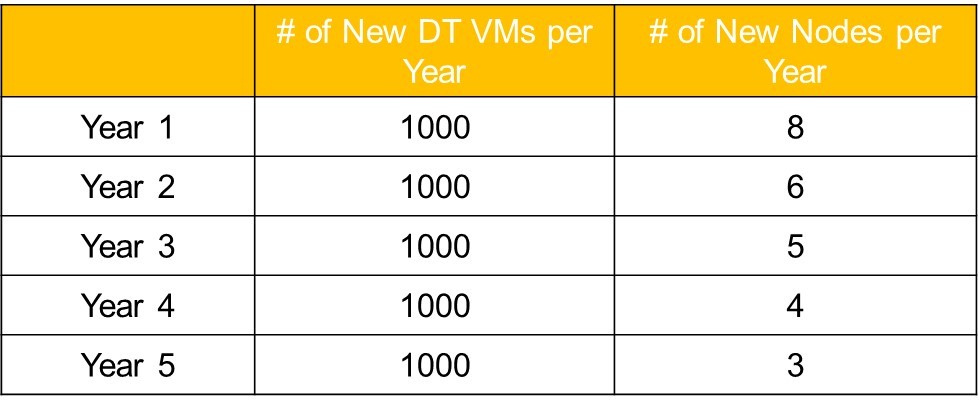
Table 2: Impact of Moore’s Law on Number of Nutanix Loads per 1,000 VMs
In year one, the customer starts off with eight nodes to handle the first 1,000 users. But Moore’s Law means that hardware continues to get faster. We saw increases in density just from moving from the Intel Ivy Bridge to Hawell chips ranging between around 20% – 80%.
Because of Moore’s Law, we estimate a conservative annual density increase in VMs per node of 20%. This means that for year 2, the customer only needs six more nodes to handle the next 1,000 users. And by year 5, the customer only needs three more nodes to handle the last 1,000 users.
This is a very powerful financial argument that is key to helping customers begin to understand why Nutanix hyperconvergence is not just a faster horse.
Mnemonic: Make sure you know how the environment will grow. Ask the customer about the average expected percentage increase she expects to grow her virtualized server or desktop environment over the analysis time period. Be sure to factor in density improvements when projecting the Nutanix cost.
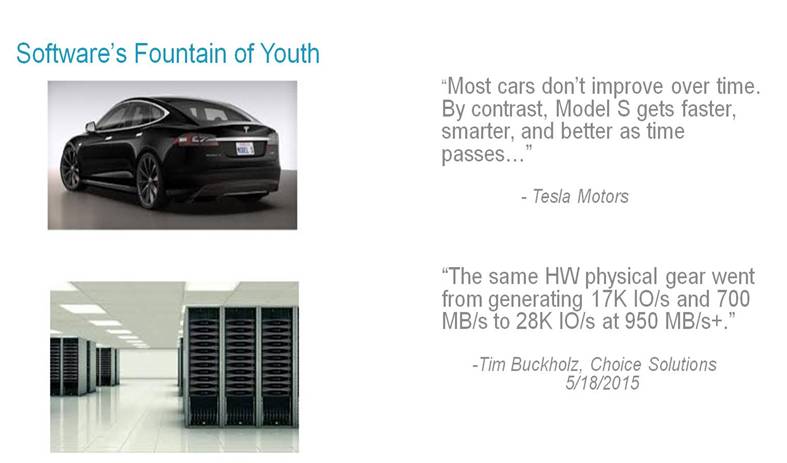
The Tesla Effect
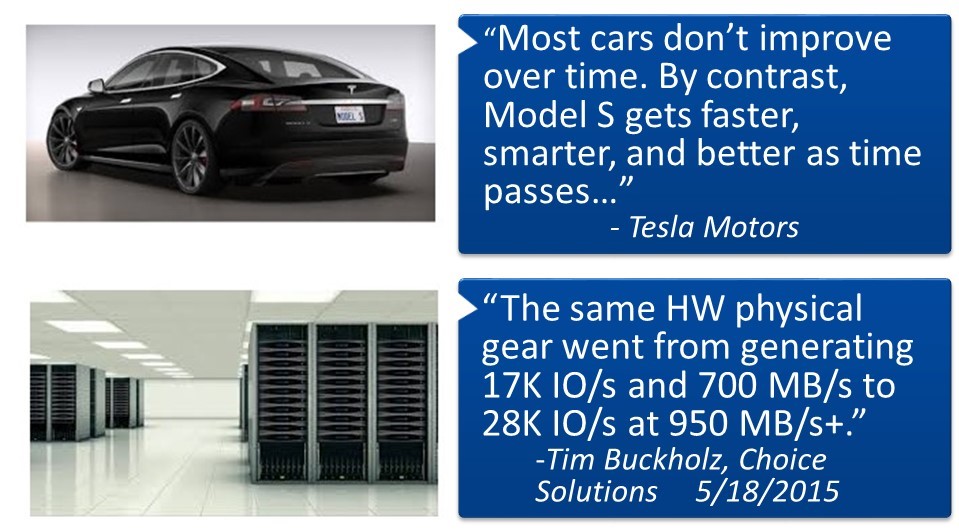
If you own a Tesla and you want to accelerate faster, corner better or – most recently, enable automated parallel parking, you download a new version of the Tesla software to your car. While the hardware remains the same, your car is in many respects like a new vehicle.
The same type of thing is true for Nutanix. Customers can non-disruptively apply the latest Nutanix OS to their existing nodes which will then perform better and have more capabilities and more features. As Tim Buckholz wrote after performing an analysis, just going from Nutanix OS 3.1 to 4.1 showed an average increase in performance of around 50%. Nutanix has seen a 5 X increase in performance resulting from software from 2012 to today.
As another example, consider Nutanix’s recently announced erasure coding. Customers applying upgrades to their older nodes will see capacity increases of around 60%.
From a financial perspective, the Tesla Effect means that Nutanix customers can grow their environments without purchasing as many new nodes. The higher workload densities, increased capacity and updated capabilities and features help optimize their investments in the original nodes.
These software-redefined enhancements are another significant differentiator of Nutanix from proprietary SANs. An array utilizes firmware that is tightly coupled with the underlying hardware. As time marches on, the existing performance, capacity and capability continues to decline in comparison to newer technology.
Mnemonic: The Tesla Effect gains increased respect. Bring up the “Tesla Effect” as a way to differentiate Nutanix from 3-tier competitors as well as add still further justification for incorporating improvements in density as part of the analysis.
Other Game-Changing Differentiators
Showing how Nutanix slashes CapEx and associated rack space, power and cooling costs over a multi-year period, while eliminating all risk of under or over buying, provides the foundation for proving Nutanix is not just a faster horse. But the TCO/ROI analysis process provides the opportunity to showcasing many of the other Nutanix game-changing capabilities as well.
Multi-hypervisor Management
Both Gartner and IDC indicate that over half of enterprise customers now run two or more hypervisors.
Nutanix helps to significantly mitigate the multi-hypervisor management challenges by providing a single pane of glass – Prism, for managing and backing up multiple hypervisors. The financial modeling can highlight the potential savings from utilizing the optimal hypervisor for different workloads.
Mnemonic: Nutanix is best at the multi-hypervisor test. Discuss the new standard of multi-hypervisor environments and how Nutanix changes the game with new capabilities in management and mobility.
Acropolis Hypervisor
It can be difficult to quantify the benefits Acropolis Hypervisor can bring in terms of simplified management, better scalability, enhanced security and bridging to public cloud. But licensing savings are easy to calculate as part of a financial analysis – especially in use cases such as test/development, branch office, big data, VDI, DevOps and so on. These savings can easily run to many millions of dollars.
Mnemonic: Acropolis cost is legacy loss. Identify potential areas where Acropolis hypervisor can save the customer money, now or in the future, and incorporate them into the analysis as appropriate.
Administrative Savings
Nutanix changes the game in terms of IT administration. Partners and customers commonly say that Nutanix’s management interface is the most intuitive in the industry. Prism Central dashboards display aggregated data around multi cluster hardware, VM and health statistics into a single management window.
Nutanix also utilizes extensive automation and rich system-wide monitoring for data-driven efficiency combined with REST-based programmatic interfaces for integration with datacenter management tools. Rich data analytics such as Cluster Health enable administrators to receive alerts in real time as the Nutanix system monitors itself for potential problems, investigates and determine root cause, and then proactively resolves issues to restore system health and maintain application uptime.
The Prism management and unsurpassed analytics capabilities combined on top of all the goodness of HCI results in tremendous administrative savings. Sometimes it is easy to quantify these savings – such as when management of the VMs is outsourced. In many cases, Nutanix either eliminates the requirement for outsourced management entirely, or reduces the cost significantly because of the slashed effort.
In cases where internal staff time is utilized for managing the environment, administrative savings can be more difficult to project. A recent extensive IDC study (You can download here) of 13 Nutanix and Dell XC customers shows average 5-year IT time savings and productivity improvements of $183,720 per 100 users.
Mnemonic: Outsourcing fees mean an ROI breeze. If the customer is currently outsourcing VM monitoring / administration, ensure they understand how vastly simpler that task becomes with Nutanix, and incorporate a reduced or eliminated cost if appropriate.
Risk Mitigation – User Productivity Benefits
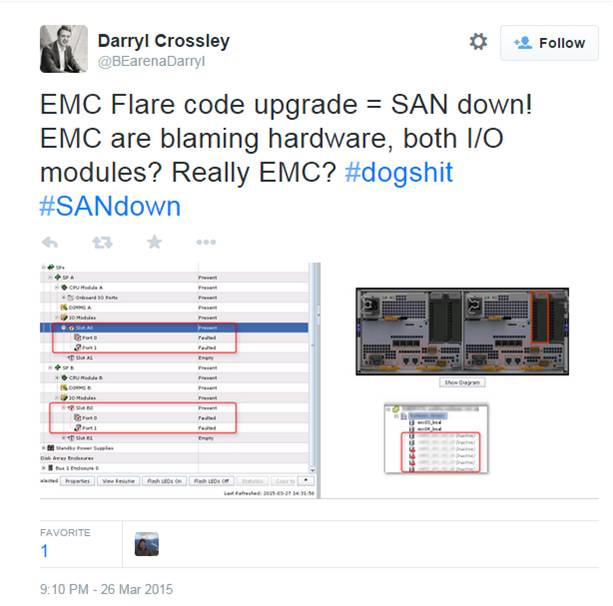
Most SANs use RAID technology which was invented in 1987 and is archaic by today’s standards. Loss of a storage controller can cut available performance in half. Losing two drives in a RAID 5 configuration, user errors, power failures and many other issues can cause unplanned downtime.
Nutanix keeps multiple copies of data and metadata both local to the VM running the active workload as well as throughout the cluster. In the event of failure, MapReduce technology is leveraged to deliver non-disruptive and quick rebuilds.
The Nutanix Distributed File System is designed for hardware failure and is self-healing. Always-on operation includes detection of silent data corruption and repair of errors around data consistency, automatic data integrity checks during reads, and automatic isolation and recovery during drive failures.
Downtime, whether planned or unplanned, can be very expensive for an organization. IDC estimates that a minute of datacenter downtime costs US $7,900 on average. The IDC study referenced above reflects average decreases in unplanned downtime of 98% and in planned downtime of 100%. This equates to 5-year savings of $43,825 per 100 users.
Mnemonic: Put downtime to bed and make 3-tier sellers see red. Discuss typical reductions in downtime with Nutanix and quantify and incorporate as part of the analysis if appropriate.
Business Productivity Benefits
It is particularly difficult to quantify the business benefits realized from improved IT agility such as reduced development cycles for applications and services and subsequent faster user access to applications and application updates. A more scalable business model, higher sales and greater flexibility are some of the resulting benefits. IDC says the average 5-year quantified value of higher employee productivity and revenue is $200,275 per 100 users.
Support
Manufacturer support is something particularly hard to quantify, but is an important differentiator to emphasize when engaged in a Nutanix financial modeling exercise. Our customers and partners validate again and again that Nutanix takes support to a whole new level. Nutanix has a 90 Net Promoter Score and is the two-time winner of the Omega Northface Award for “Delivering World Class Customer Service.”
TCO vs. ROI
Many organizations use the terms “TCO” and “ROI” interchangeably, but they are very different. Use a TCO analysis in situations for when a customer is either considering migrating from an existing virtualized infrastructure either to Nutanix, or to a new (or refreshed) 3-tier architecture vs. Nutanix. Use an ROI analysis when comparing remaining with a status quo environment (whether physical or virtual) vs. making the investment to migrate to Nutanix Web-scale.
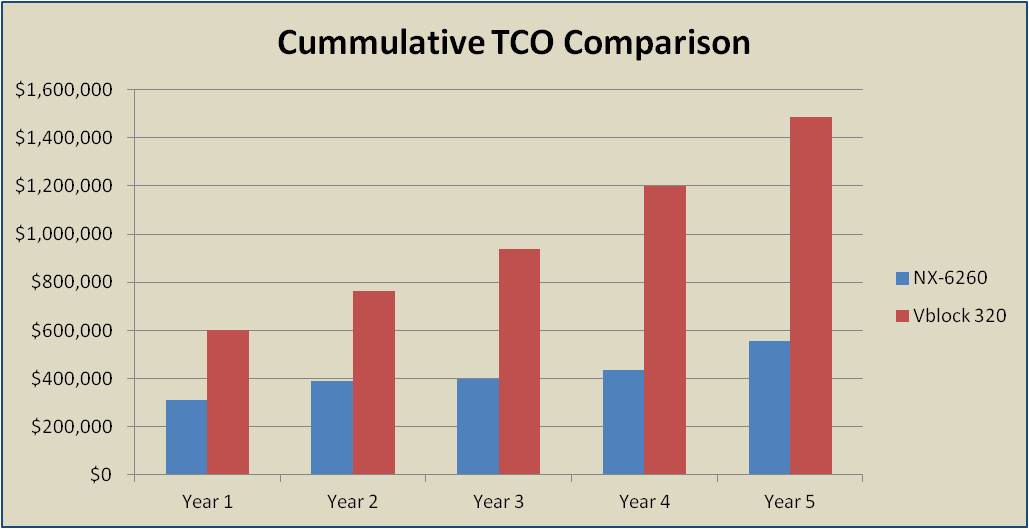
A financial company, for example, was running a Vblock 320 for a mixture of XenApp and sever VM workloads – and they were getting ready to purchase a second unit. But after learning about Nutanix, they became very intrigued with the simplicity and capability for things such as one-click upgrades. They also requested a TCO analysis comparing the cost of purchasing a second Vblock to an equivalent Nutanix solution.
Table 3 below shows the results of the analysis. This is presented in a yearly cash flow format (which is typically the way finance folks like to see it).
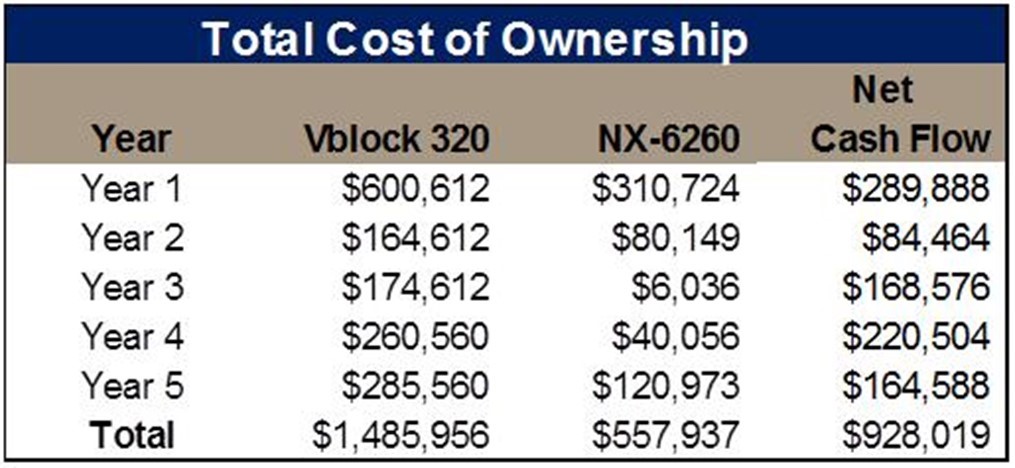
Table 3: Five Year TCO Results
While the Nutanix configuration was less expensive up-front than the Vblock, this is not always the case when comparing against 3-tier infrastructure. However, when incorporating projected upgrade costs over a 5-year period along with variables such as rack space, power, cooling, administrative costs, fibre channel cabling, etc. – Nutanix should always blow away the competition.
The financial company ended up purchasing Nutanix and reported a 10% – 20% improvement in performance over the Vblock. The CIO commented, “And then there is the management simplicity — the Nutanix systems have required almost no support so far.”
Mnemonic: When competing vs. status quo, use ROI, not TCO. Generate a TCO analysis if competing against another new solution or an ROI analysis if competing against a status quo environment.
Analysis Scope
A customer typically will consider Nutanix for a specific use case or department. This is a great starting point, but for purposes of the financial analysis, I recommend expanding the scope.
If the request is for departmental VDI, for example, suggest looking at the potential economic savings from virtualizing the entire user base (or whatever percentage of that user base is reasonable to virtualize over the next five years). If the request is for a cost comparison vs. a particular server use case, expand the scope to consider all virtualized servers. And then incorporate backup and DR in order to highlight the game-changing capabilities Nutanix provides in areas such as metro availability and Cloud Connect.
Expanding the analysis scope enables the customer to better evaluate the proposed smaller initiative within the context of a big-picture scenario. This in turn enables both better decision-making and often more optimized deployment of resources when the initiative moves forward.
Mnemonic: Don’t just hope; expand the analysis scope. Expand the scope of the analysis to include as many users, VMs, use cases as make sense to enable a big-picture context for the initiative.
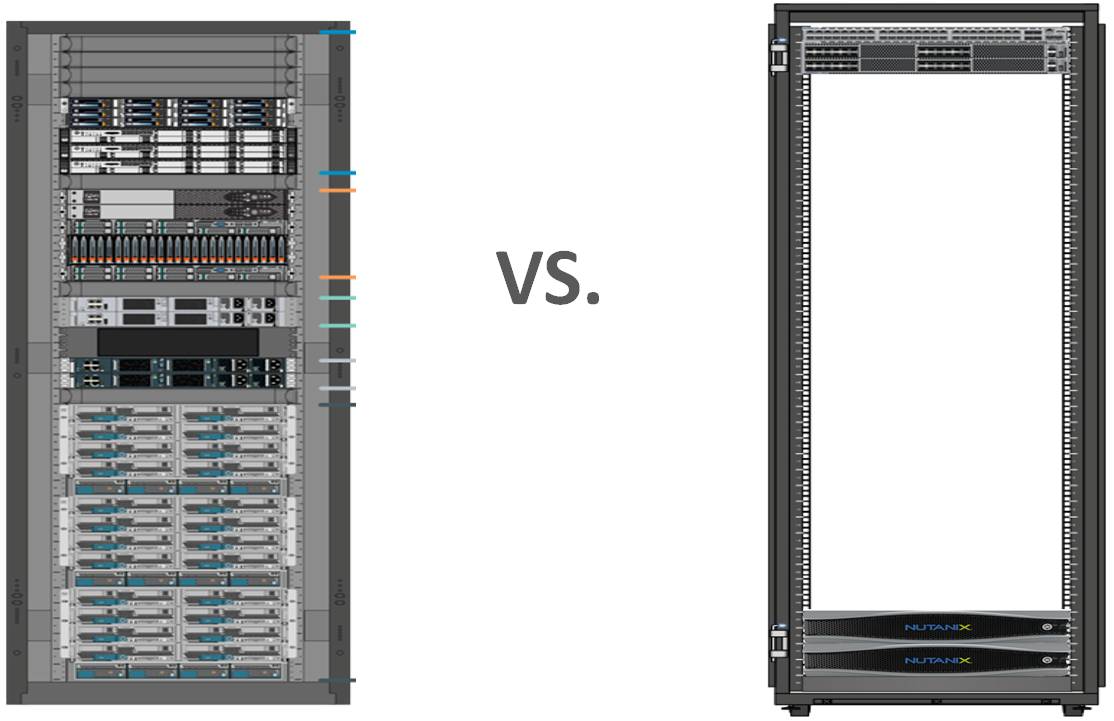
Before/After ROI Picture or TCO Comparison Picture
This Visio diagram was generated by Dave Hunter, Director of IT for Empire Life, named the “Best Life Insurance Company in Canada in 2014” by World Finance Magazine. The drawing shows the huge rack space savings that Dave achieved through consolidation of mainframe, physical servers and virtualization hosts to a Nutanix environment. Whether looking at ROI or TCO, a picture can help highlight the extraordinary space savings Nutanix enables.
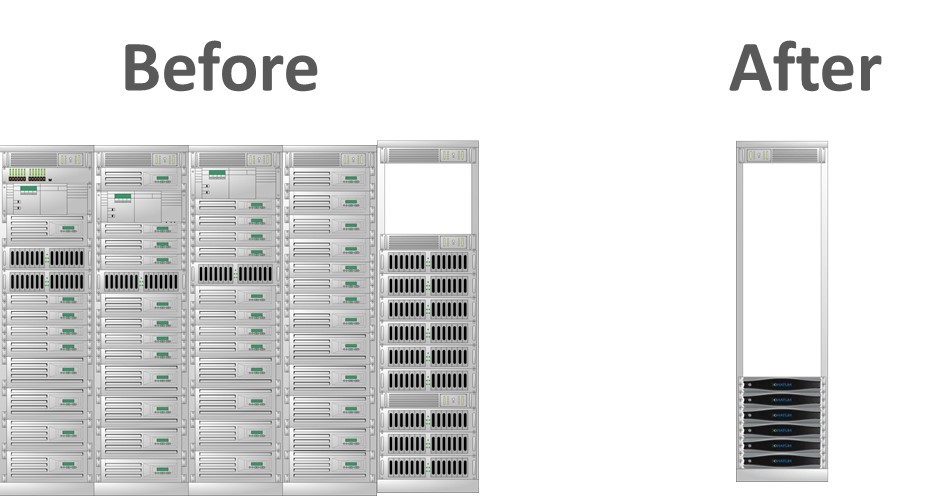
Mnemonic: A representative picture should be an analysis fixture.
The Ideal Analysis Results
A TCO or ROI analysis is most successful when the numerical comparison between Nutanix Web-scale and legacy 3-tier is no longer the primary evaluation criteria for the customer. The process of taking the customer through the analysis makes it clear that Nutanix will not only be far more beneficial for the organization overall, but that it will change her datacenter management experience in terms of simplicity, predictability, scalability and resiliency.
See Also:
IDC Study on TCO & ROI of Nutanix vs. Traditional Infrastructure. Download from Nutanix Web site.
I, for one, Welcome the Rise of the Infrastructure Endgame Machines. 08/20/2015. Trevor Pott. The Register.
Empire Life Saves 60% in Infrastructure Costs and 16:1 Reduction in Datacenter Space. 07/09/2015. Jeff Babcock (video). Nutanix YouTube.
Nutanix Customers Weigh in on “Invisible Infrastructure” and Overcoming IT Bottlenecks. 06/12/2015. Jon Reed. Diginomica.
Nutanix Beating EMC, Says It’s Cutting Customer IT Costs 62%. 11/21/2014. Peter Cohan. Forbes.
Thanks to @vmmike130 for editing.